



Revenue forecasting and MMM. Things I couldn’t pull off as a PPC specialist before.
Problem: Twice a year, a client asks me two questions I haven’t been able to answer properly for a long time. “How much will we make next quarter?” and “Where should I put more budget to get the best return?” The honest answer used to be: “Based on my gut feeling and the ROAS in the dashboard.” But the ROAS in the dashboard systematically lies, and a gut feeling isn’t a plan.
There is a correct answer to both questions—it’s called time-series forecasting (Prophet) and Marketing Mix Modeling (causal, Bayesian). Except it’s a job for data scientists: Python, statistics, data engineering. Agencies with data teams have it, enterprise companies have it. A solo PPC specialist didn’t—because knowing PPC isn’t enough; you also have to know how to build it. And I can’t write a single line of Prophet or Meridian (or Python, for that matter).
This has changed. With Claude Code, I built both the forecast and MMM directly into my reporting. In this article, I’ll show you what it can actually do, how it’s put together under the hood, and most importantly, where it tripped me up—because “AI predicts the future” is a marketing fairy tale, and I’m writing about how it really is.
Table of Contents
- 1. What I’ve always wanted to master — and why I didn’t have what it takes
- 2. What changed: the barrier wasn’t the idea, but the code
- 3. Revenue forecast: from gut feeling to probability
- 4. Marketing Mix Model: Where to allocate your budget (and why)
- 5. How it’s built (under the hood)
- 6. Where I tripped up (the honest part)
- 7. Why I’m writing this: the bar has been raised, not just my stack
- Conclusion
- FAQ
1. What I’ve always wanted to master — and why I didn’t have what it takes
The two most expensive decisions in PPC aren’t “which headline” or “what bid”. They are:
- How much it’ll bring in — so you can plan your inventory, cash flow, capacity, and budget.
- Where to put that budget — so you get the most bang for your buck.
The first can be answered with a revenue prediction. The second by measuring the actual contribution of individual channels — not what each system attributes to itself (that’s what my entire previous article was about), but how much revenue would realistically never have happened if you turned the channel off.
Both are solvable. Both have established tools. And both were out of reach for individuals for years because:
- Forecasting isn’t just “dragging a line in Excel.” You need to decompose revenue into trend, yearly and weekly seasonality, the impact of holidays and promotions, and ideally external factors (weather). That’s what a library like Prophet by Meta does — and building validation, backtesting, and interpretation around it is a project in itself.
- Marketing Mix Modeling is a whole other level: a Bayesian model that estimates the causal incremental ROI of each channel, its saturation, and the optimal budget allocation based on historical spend and revenue. Google has an open-source library for this called Meridian (built on TensorFlow Probability). This is literally the kind of math they teach in university statistics courses.
I’m a PPC specialist. I can read and interpret these things, but I wouldn’t be able to code them in a month, even with the documentation. And that was exactly the barrier — not the idea, but the implementation.
2. What changed: the barrier wasn’t the idea, but the code
With Claude Code, I built a prediction layer for my reporting in just a few weeks (in phases: first the worker infrastructure, then Prophet forecast, then Meridian MMM). Not just a notebook prototype — a production-ready tool running on real client data.
The barrier was never that I didn’t know what I wanted to calculate. It was that I didn’t know how to write the code. AI unlocked that second half—it handles the coding, while I provide the domain expertise (what to predict, how to read it, where it’s lying). And that second part is still the harder and more valuable piece of the puzzle.
The stack in a nutshell: Prophet for revenue forecasting, Meridian for MMM, data flows from GA4 + order feed → BigQuery, enriched with weather and holiday calendars. Details are in section 5, but first, the important stuff — what actually comes out of it.
3. Revenue forecast: from gut feeling to probability
The first thing is a revenue prediction for 13 weeks ahead (roughly a quarter). And right away, the first honest point: it’s not a single number, it’s a range.
The model returns three lines — P10 / P50 / P90. P50 is the most likely scenario (median), P10–P90 is the 80% confidence interval. So instead of “we’ll hit 1.4 million,” I say “with 80% probability, it’ll be between 1.2 and 1.6 million, most likely around 1.4.” That’s the difference between a prophecy and a plan — you plan for a range, not a single point.
The second honest point: I calculate it from real orders, not from GA4. GA4 is consent-skewed (the cookie bar can easily strip away 40% of the data), so it doesn’t hold up as a source of truth for revenue. The order feed is the truth; GA4 is just a fallback when the feed isn’t available.
But the most valuable part isn’t the line itself. It’s the decomposition that tells you WHY. The model breaks down the prediction into drivers:
How drivers shape the forecast (contribution over horizon):
  Trend ............. +4.7 %   (long-term account growth)
  Yearly season ..... +18  %   (strong period ahead)
  Holidays & promos . -3.9 %   (post-Black-Friday dip)
  Weather ........... -5.2 %   (category temperature pattern)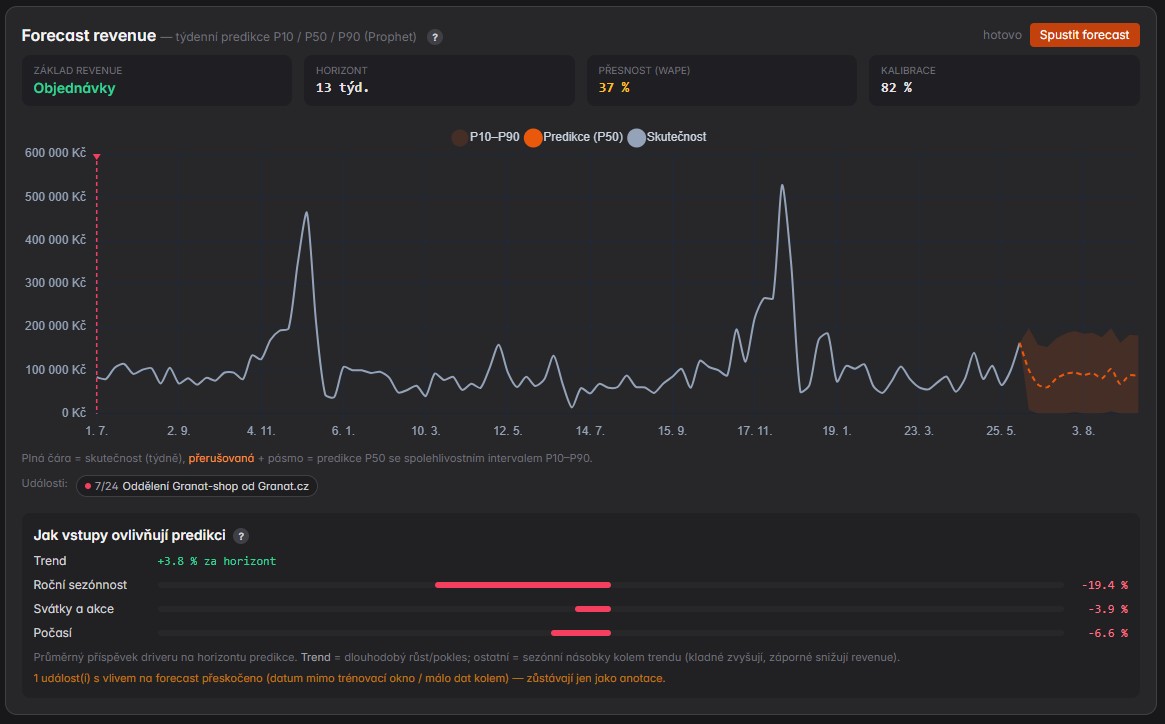
This is something I never show a client straight from a dashboard: “that growth you see in the forecast is 2/3 seasonality, not your doing — and expect things to cool down after the holidays.” Suddenly, we’re not just debating gut feelings.
Now, let’s talk accuracy, because without it, this is useless. The model runs a rolling-origin backtest on itself (predicting the past it already knows and comparing the results) and spits out two numbers:
- WAPE (weighted absolute percentage error) — for weekly revenue, I’m realistically hovering around 38%. That’s not a typo. E-shop revenue is volatile; on a daily level, the error can easily hit 75%, which is why I report a weekly aggregate rather than a daily one.
- Coverage (calibration) — the % of weeks where the actual results fell within the P10–P90 range. The target is ~80–90%, and that’s where it stays.
In other words: it’s not precise, but it is honestly calibrated. I’m not promising you an exact number. I’m promising you a range it will likely fall into — and when it comes to planning, that’s exactly what you want.
4. Marketing Mix Model: Where to allocate your budget (and why)
This part is my favorite because it answers the question that ROAS in your dashboard can’t: how much value is each channel actually adding?
Let me recap the point from last time: ad systems each claim the same conversion for themselves (duplication), while GA4 reads it as last-click. Totaled ROAS is pure fiction. MMM takes a completely different approach — it uses your spend and revenue history to statistically estimate how much revenue was generated because of each channel (causally, rather than just who claimed the credit). I use Meridian (Google’s Bayesian MMM) for this.
What you get is a table that might give you the chills (these are illustrative numbers from a sample account, not a real client):
CHANNEL      ROI (90% CI)     MROI    SPEND/wk    SUGGESTED    Delta
PPC Google   17.1x [14-20]    11.9x   9,800 CZK   11,700 CZK  +20 %
PPC Meta      2.2x [0.3-7]     1.0x   3,300 CZK    2,300 CZK  -30 %
PPC Sklik     1.6x [0.3-4]     0.7x   3,200 CZK    2,200 CZK  -30 %
--------------------------------------------------------------------
At the SAME total budget -> shift to the higher-return
channel -> +11 % revenue at the same cost.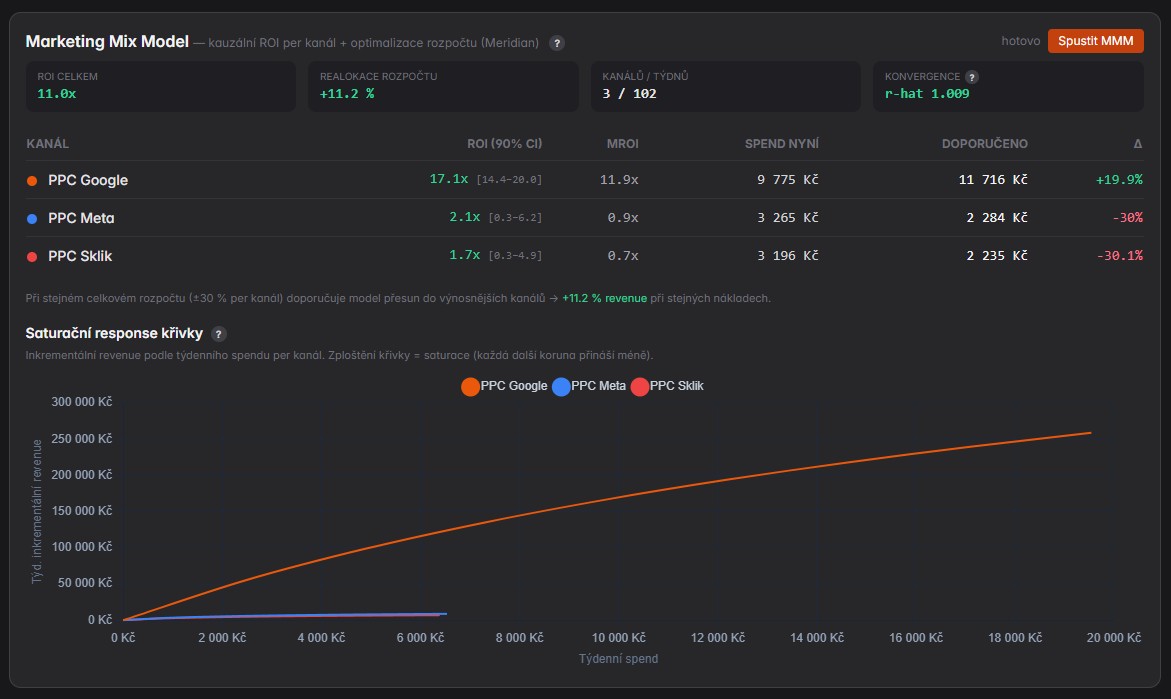
Two things you need to be able to read there:
- ROI vs MROI. ROI is the average incremental ROI of the channel. MROI (marginal ROI) is the more important number: how much the next invested crown returns. Google has an MROI of almost 12 — there’s still room to pour more in. Meta and Sklik have an MROI around 1 — they are saturated, the next crown will barely break even.
- Confidence interval.
[0.3–7]for Meta isn’t a precise number; it’s “we don’t know exactly, but it’s likely low.” The Bayesian model acknowledges uncertainty — that’s a feature, not a bug.
Model conclusion: with the same total budget (with a ±30% limit per channel to keep things from getting wild), shift money from saturated channels to Google → +11% revenue for the same cost. This is a decision I used to make by gut feeling. Now I have the data to back it up.
This is complemented by the saturation curve of each channel — a graph of incremental revenue based on spend. Google’s curve is still climbing (underspent), while the Meta/Sklik curve has flattened out (saturation, every additional crown brings in less). Visually, you can immediately see where the ceiling is.
5. How it’s built (under the hood)
Data pipeline:
GA4 Data API  --+
Orders feed (source of truth) --+--> BigQuery -> Dataform marts -> weekly aggregates
Spend per channel --+             + weather (Open-Meteo) + holiday/promo calendar
                  --+
Forecast (Prophet):
- Multiplicative seasonality for e-shops (additive for B2B/leads), weekly + yearly seasonality.
- Holidays and events as regressors (Black Friday and the like have their own window of influence).
- Temperature as a regressor — and here’s a solid trick: you can only forecast weather about 14 days out. Further into the future, the model doesn’t use a weather forecast (it doesn’t exist), but rather the climatological normal (the long-term average for that specific day of the year). No magic, just a solid estimate.
- Validation via rolling-origin backtesting → WAPE + coverage.
MMM (Meridian):
- Bayesian model (TensorFlow Probability, MCMC sampling) — that’s where those confidence intervals come from.
- Adstock (the decay of ad effect over time, carryover) + Hill saturation (diminishing returns).
- Budget optimizer with a ±30% limit per channel, fixed total budget.
- Convergence check (r-hat — whether the model “finished its math”; anything over 1.2 triggers a warning).
Operations: it runs as a standalone Python 3.12 worker (Prophet and Meridian don’t have wheels for 3.14 yet), as a nightly batch — not real-time. The job gets queued, the worker processes it, and saves the result.
The point of this section: a year ago, I wouldn’t have been able to explain any of these terms to you — adstock, Hill saturation, MCMC, r-hat — let alone code them. I had the domain knowledge, but not the implementation skills. AI provided the latter.
6. Where I tripped up (the honest part)
None of this is a crystal ball. Here are the specific limits you need to know before you sell this to anyone:
- A forecast is a range, not a number. A WAPE of 38% means weekly accuracy is lousy—the value lies in the calibrated range and the driver breakdown, not in one magic number. Anyone promising an exact revenue prediction is either lying or hasn’t measured anything.
- Daily granularity makes no sense. Daily revenue is too volatile (WAPE ~75%). I only report weekly.
- MMM needs data. It’s only reliable with at least ~1 year of weekly history. Anything less, and I switch the model to simpler response curves.
- It’s correlation elevated to causality, not proof. MMM is an observational model—it accounts for weather and holidays, but it doesn’t know about competition, macro factors, or anything I haven’t measured. It estimates causality using Bayesian methods, but it cannot prove it. Real confirmation = experiment (geo holdout, blackout test—I’ve written about them). That’s my next step: pairing MMM with real experiments.
- It doesn’t see structural breaks. A new product, rebranding, a major new campaign—the model assumes past patterns still hold. It won’t predict a future it has never seen.
- Spend-only simplification. Meridian ideally wants impression-level data; I’m giving it pure spend. For the Czech market with limited exposure data, it’s an acceptable compromise, but it’s an approximation.
So I don’t treat it as an autopilot, but as a basis for decision-making. I read the numbers with PPC judgment—because even the best model is only as good as the person reading it.
7. Why I’m writing this: the bar has been raised, not just my stack
Until recently, this was a privilege reserved for agencies with data teams and enterprises with the budget for a data scientist. A solo freelancer couldn’t afford forecasting and MMM — not because of the money, but because of the skills.
That’s out the window. Not because I learned Bayesian statistics overnight, but because code is no longer the barrier. AI writes it. What remains — and what is actually becoming more valuable — is knowing what to build, how to read it, and where it’s lying. That’s the domain expertise, and you won’t get that from a prompt.
It’s the same line I repeat in every article about AI: it won’t replace PPC specialists. It will replace PPC specialists who don’t know how to use it. Except now, it also applies to things that were out of reach for anyone without a data team just a year ago.
Conclusion
A year ago, when asked “how much will we make next quarter and where should we put the budget,” I used to answer based on gut feeling and the ROAS from the dashboard. Today, I answer with a calibrated revenue range broken down by drivers and causal incremental ROI per channel with a recommended budget reallocation. It’s still not a crystal ball — it’s an honest, probabilistic foundation. But it’s levels above just a hunch.
And the most important thing: a data scientist didn’t build this. A PPC specialist built it, someone who had an idea and a tool (Claude Code) that wrote the code for him. The implementation barrier has vanished — only judgment remains.
If you’re curious about what a forecast and MMM would show on your data — or if you’re considering building something similar and want to discuss where the catches are — get in touch. I’d love to chat about it, especially with colleagues in the industry. The more of us use this, the faster the bar will be raised for everyone.
What would a forecast and MMM reveal about your data?
I’ll show you where your account hits its ceiling, where to shift your budget, and what the probabilistic revenue forecast looks like. Straight talk, no hype.
FAQ
- What is Marketing Mix Modeling (MMM)? A statistical (in my case, Bayesian) model that estimates the causal incremental ROI of each channel based on spend and revenue history—how much revenue wouldn’t have happened if you turned the channel off. Unlike last-click attribution, it doesn’t care about who gets the credit, but who actually added value.
- How accurate is the revenue prediction? On a weekly level, WAPE stays around 38%; daily, it’s even worse. That’s why I don’t present it as a single exact number, but as a P10–P90 range with ~80–90% coverage. The real value lies in the decomposition into drivers (trend / seasonality / holidays / weather).
- Do I need a lot of data for MMM? Yes. Reliably, at least a year of weekly spend and revenue history per channel. Less data → simpler response curves instead of a full MMM.
- Does MMM replace experiments (A/B tests, geo holdouts)? No. MMM is observational—it estimates causality but doesn’t prove it. The gold standard is still the experiment; MMM and experiments complement each other.
- Don’t you need to know how to code? I can’t write Prophet or Meridian from scratch. I built it using Claude Code—I provided the domain expertise (what to predict, how to interpret it, where the limits are), and the AI wrote the code. That’s exactly why I’m writing about it: the barrier has shifted from “can you code it” to “do you know what and why.”
- Does it run in real-time? No, it’s a nightly batch. Forecasting and MMM are tools for planning and budget allocation (weeks/quarters), not for hourly decisions.